October 30, 2017 grafana influxdb statsd testing
Introduction
This is the first post from a four-part series that will take you through the basic concepts, building the development environment and a production ready solution for real-time metrics for any application/service.
SPOILER: At the end of these series you’ll be able to deliver a production ready metrics system and build great dashboards with Grafana with an InfluxDB back-end.
Sneak-peek
Starting a somewhat basic example that we’ll explore during this series:
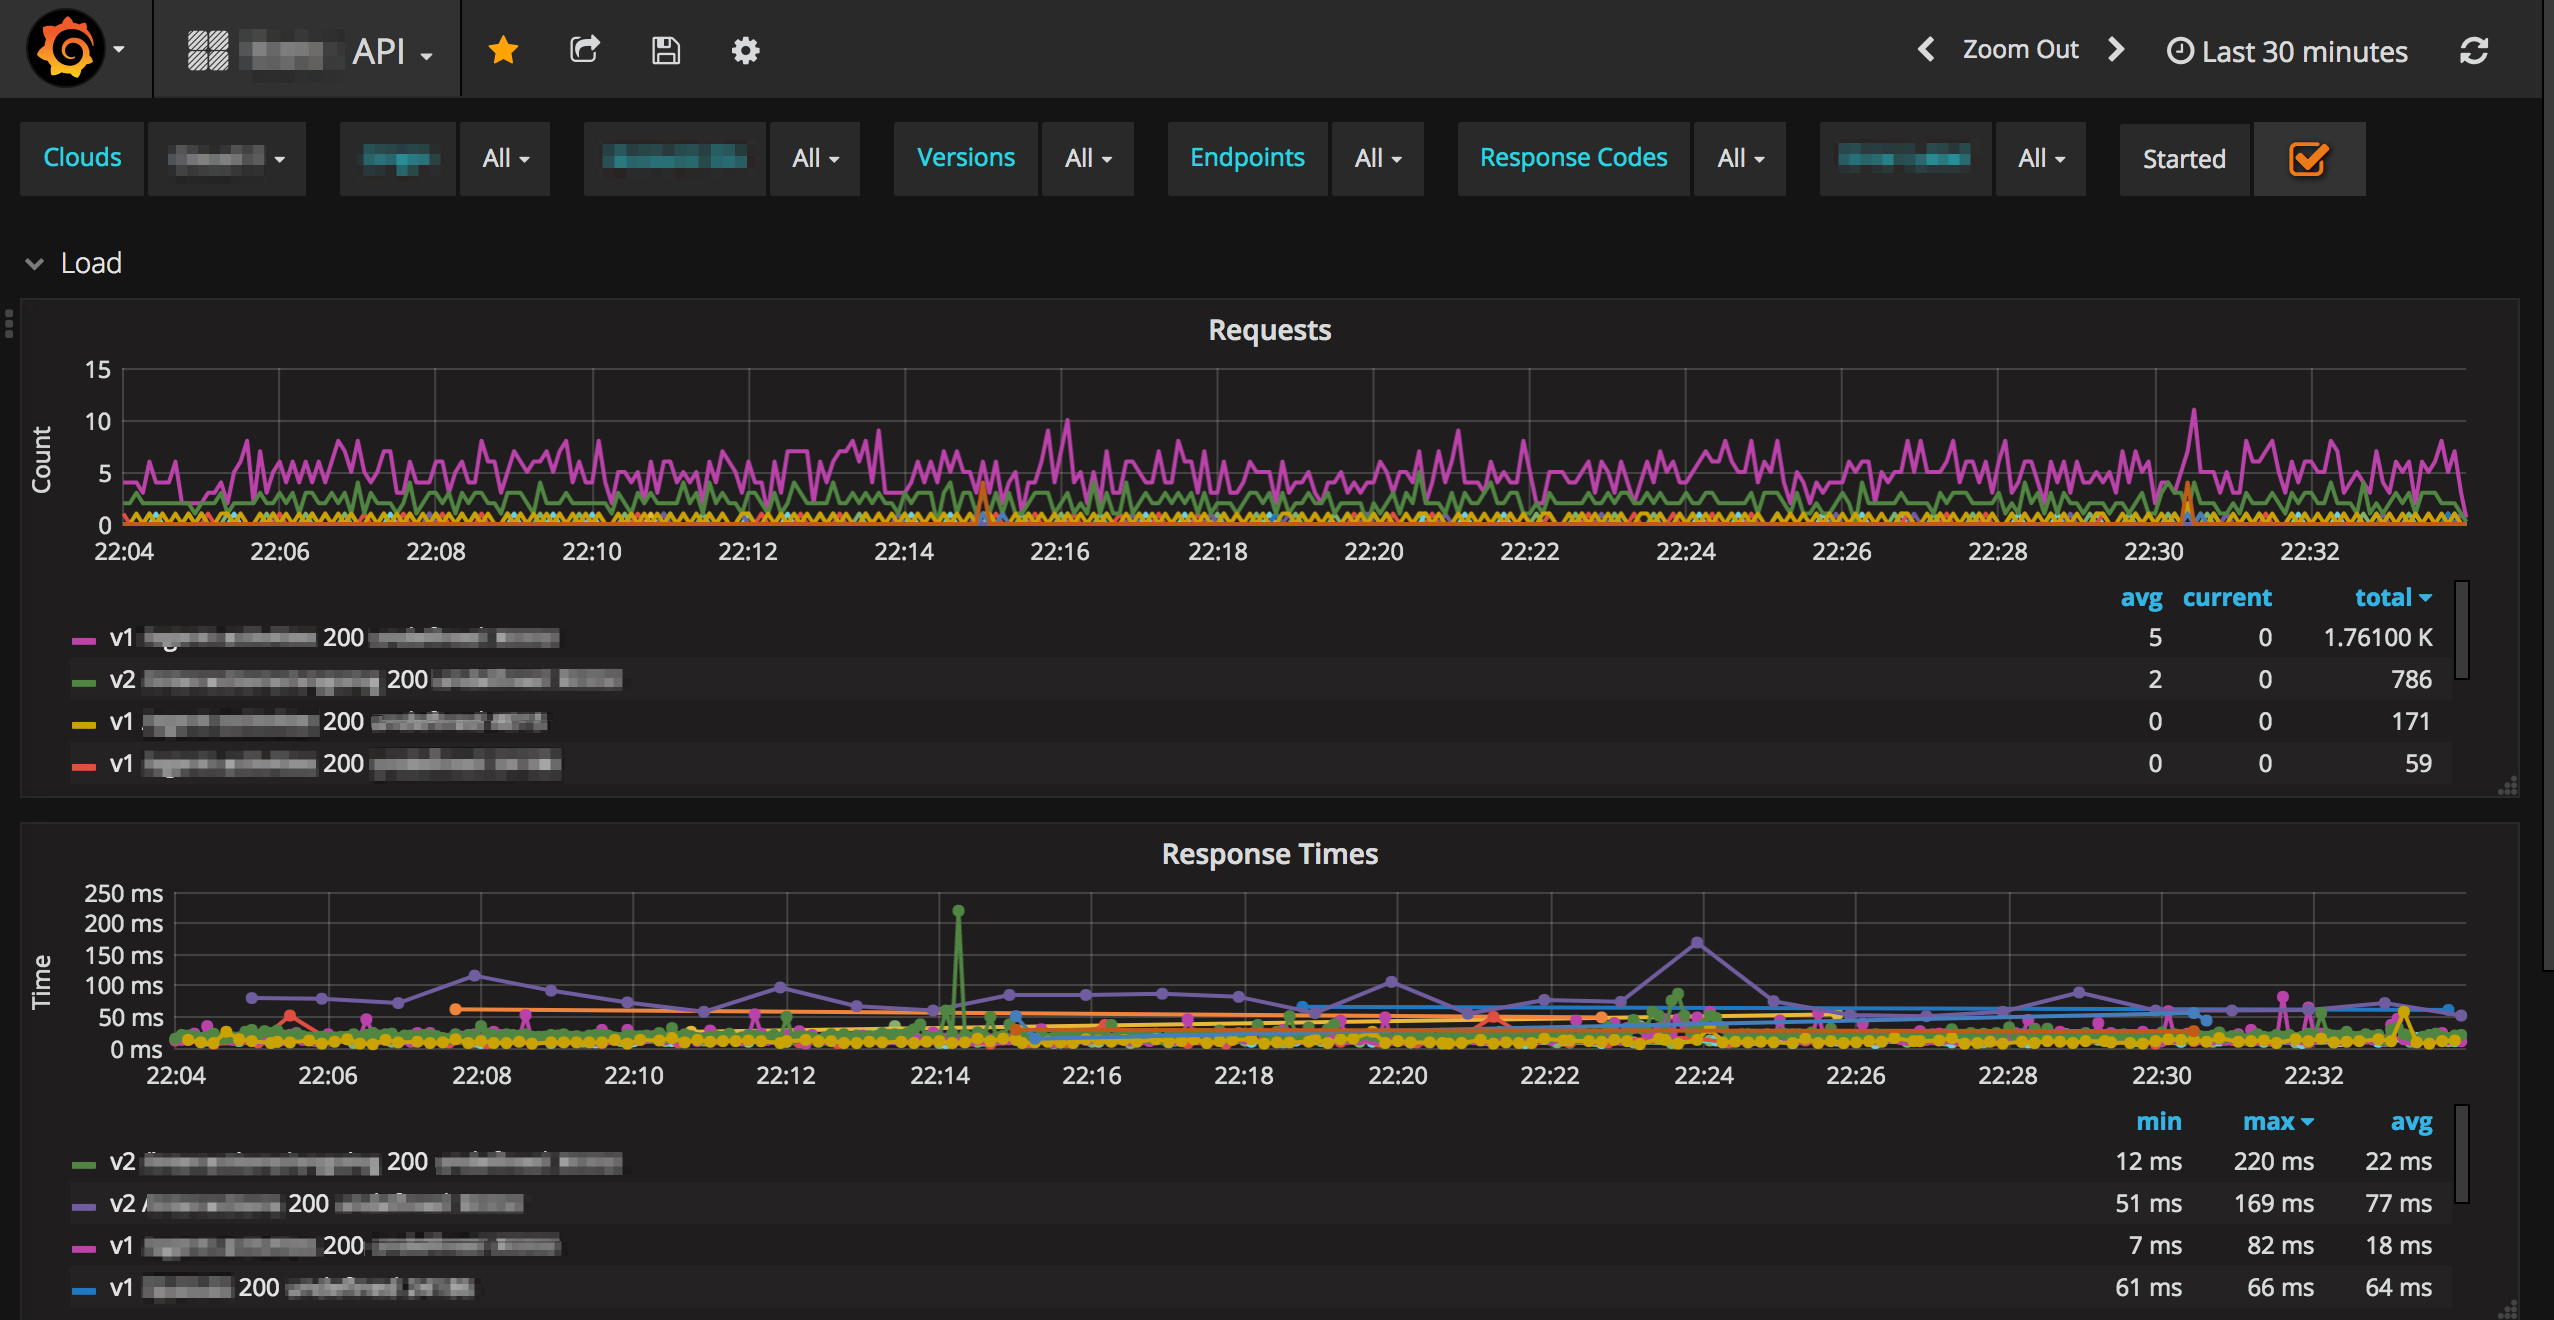
Graphing requests count and response times of HTTP requests
Explore the many possibilities browsing Grafana Demo Dashboards:
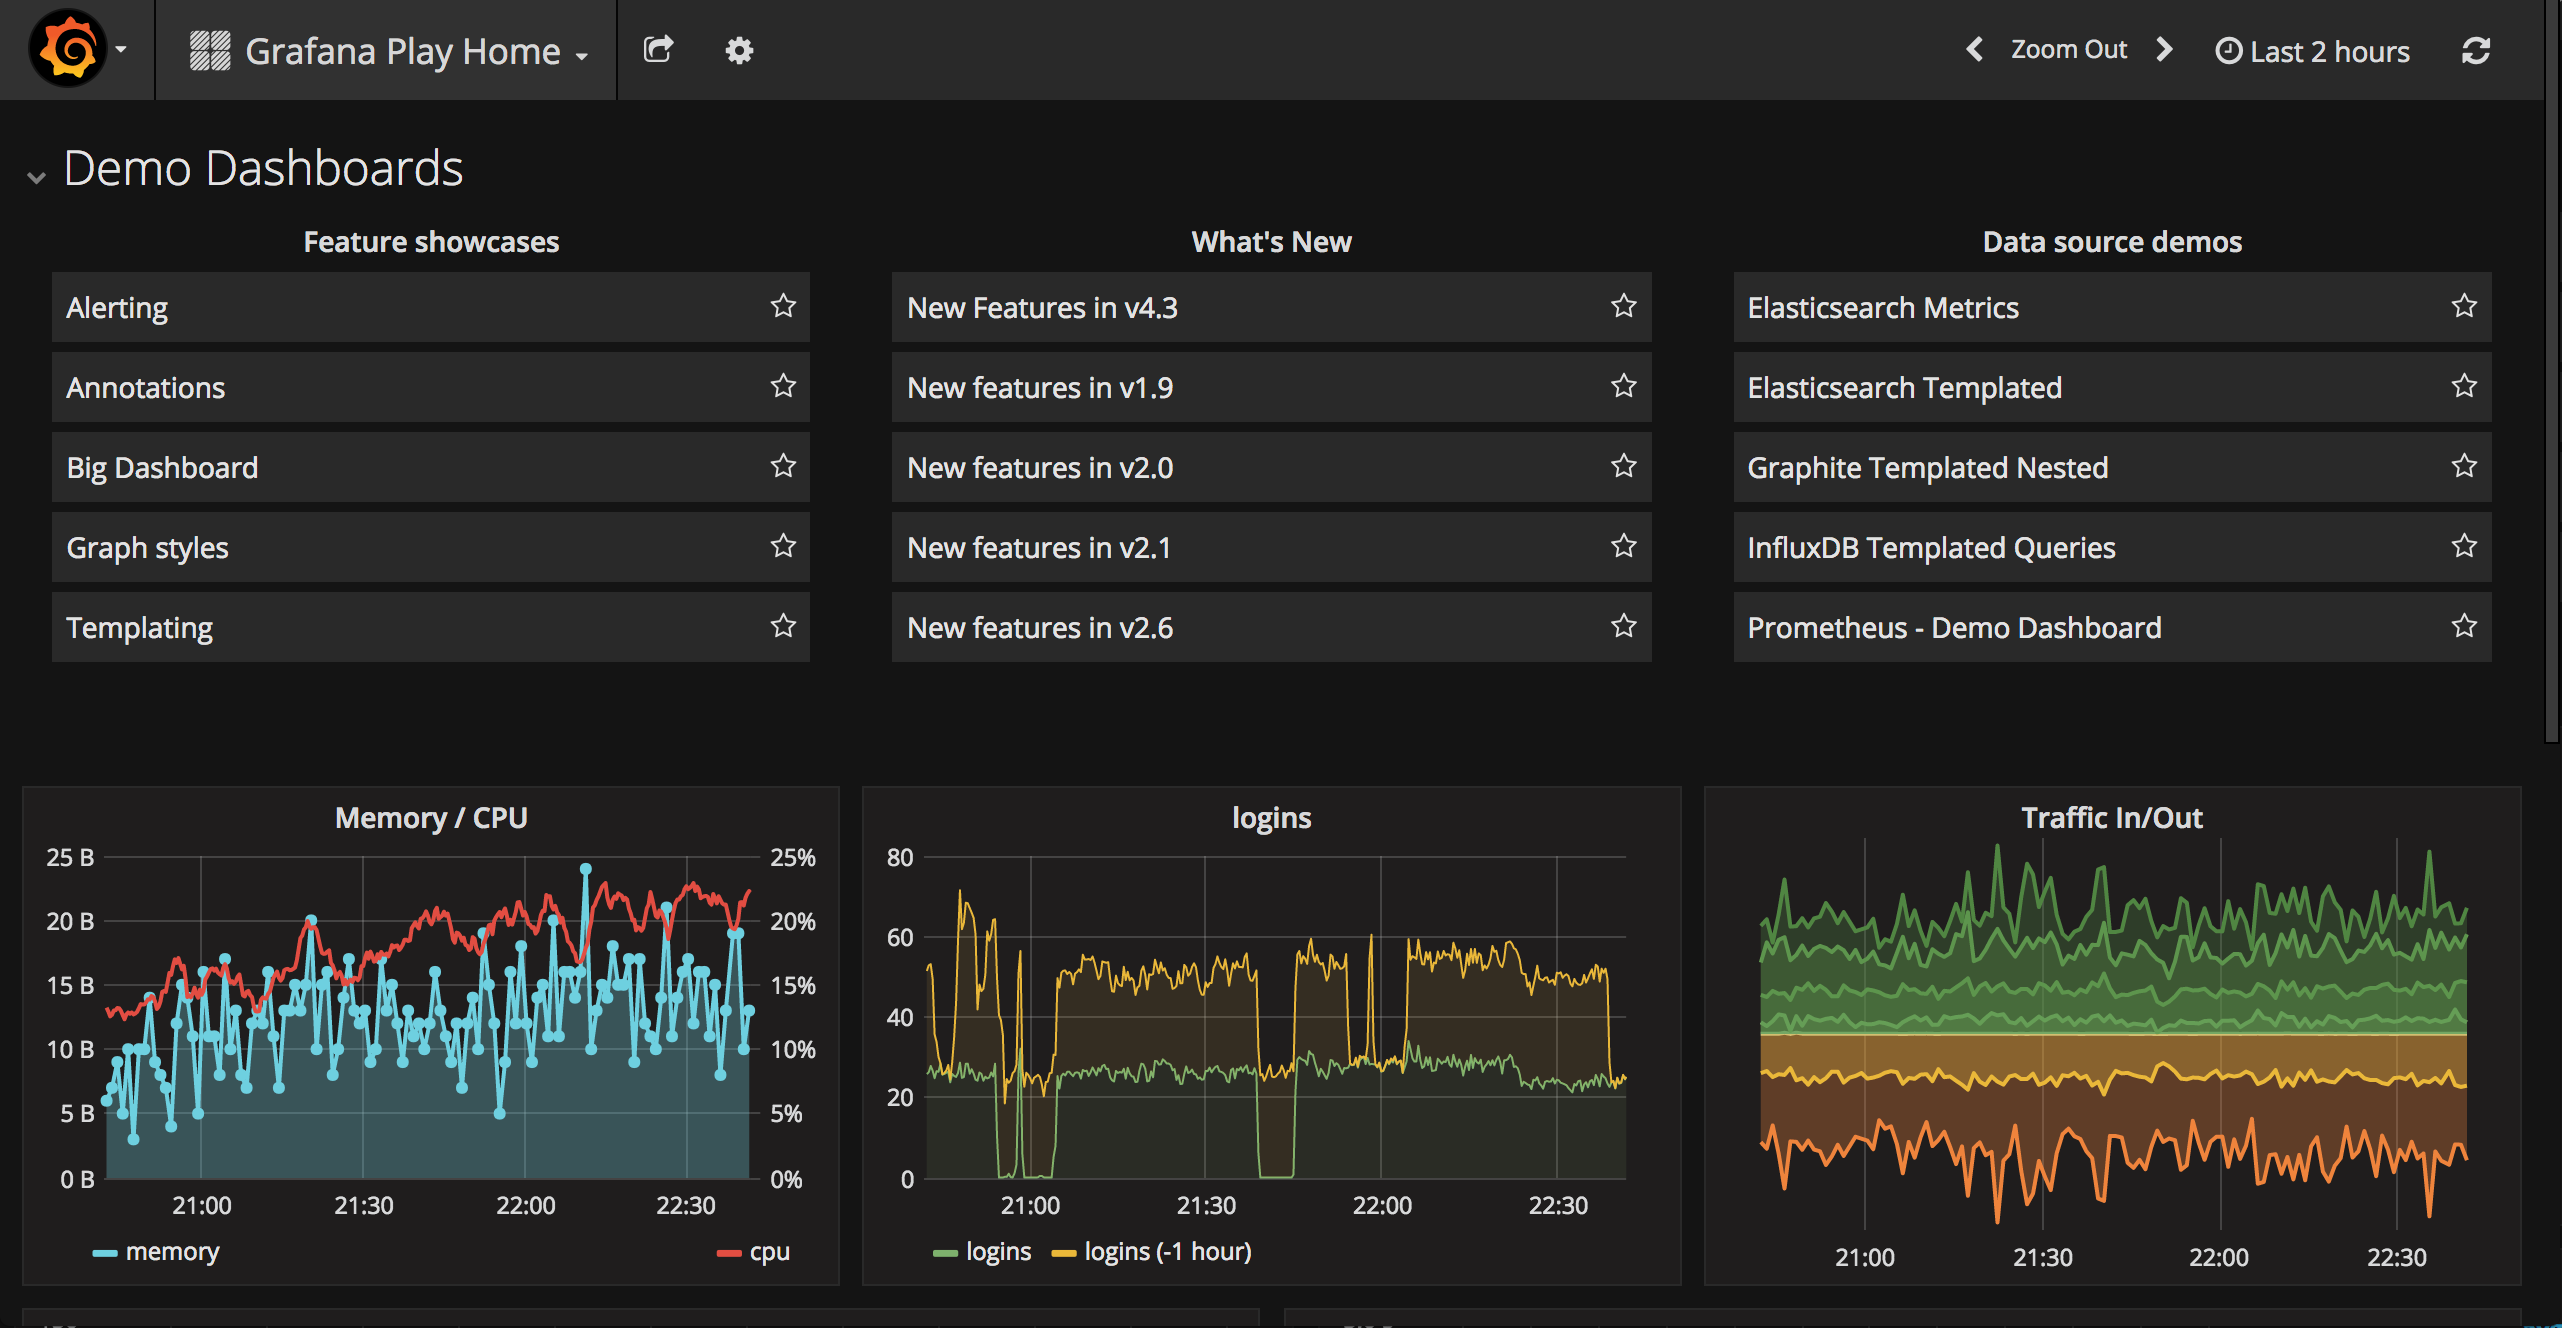
A world of possibilities
Why use metrics
I’m privileged to work on a team where metrics became a fundamental part of Definition of Done and as a result, pretty much everyone grasps this topic very well and contributes to the constant improvement of our dashboards.
We use metrics to surface valuable telemetry information from all the services that the team builds and manages. Many tools can monitor any process, but nothing replaces the value and truth from the information that the service broadcasts from its process.
Storing metrics on a time series database like InfluxDB and visualizing your data with Grafana is a great way to “read” your service or set of services behaviour from errors to performance aspects. These are amazing tools, explore them (or similar alternatives) and you won’t regret it.
Use cases
A short list of some cool metrics you can add to your services and the benefit you can extract:
Graph heartbeat signal similar to an ECG to give you a nice perspective of the health state. Perfect to observe service state when upgrading and restarting;
Graph HTTP requests and their response time. Perfect to read the way your service performs;
Extending the previous metrics to show the time it took to retrieve data from the database;
Graph error/exception rates. Imagine you’re deploying a new version of your service and you can combine a visualization with your logs to see if everything is alright with the new version;
Show an annotation with a few labels every time a service starts or stops. Expose useful information like hostname, version, etc, on service start up;
And so many other examples.
What’s next
Stay tuned for my next post where I’ll take you through the details of how to setup a quick and easy development environment using Vagrant.
PS: A big thanks to @MattDavey who introduced the fundamentals to me and the team. It’s his fault that we’re all now hooked on metrics and Grafana in particular.